jobs market in india magazine style report
-
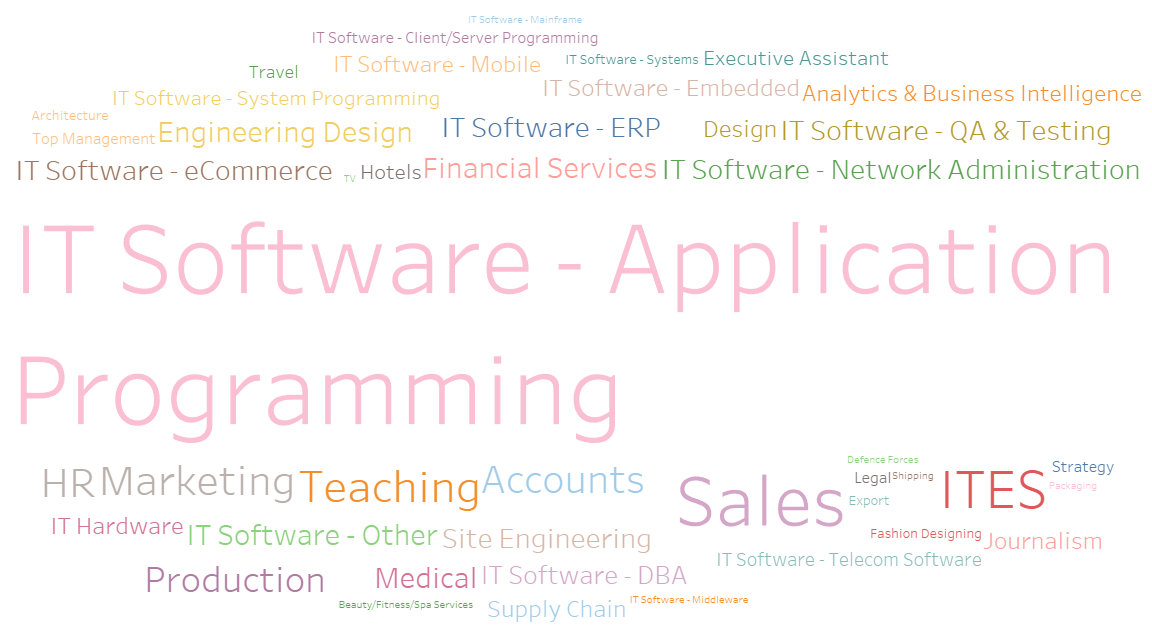
Skillsets - Word Cloud
-
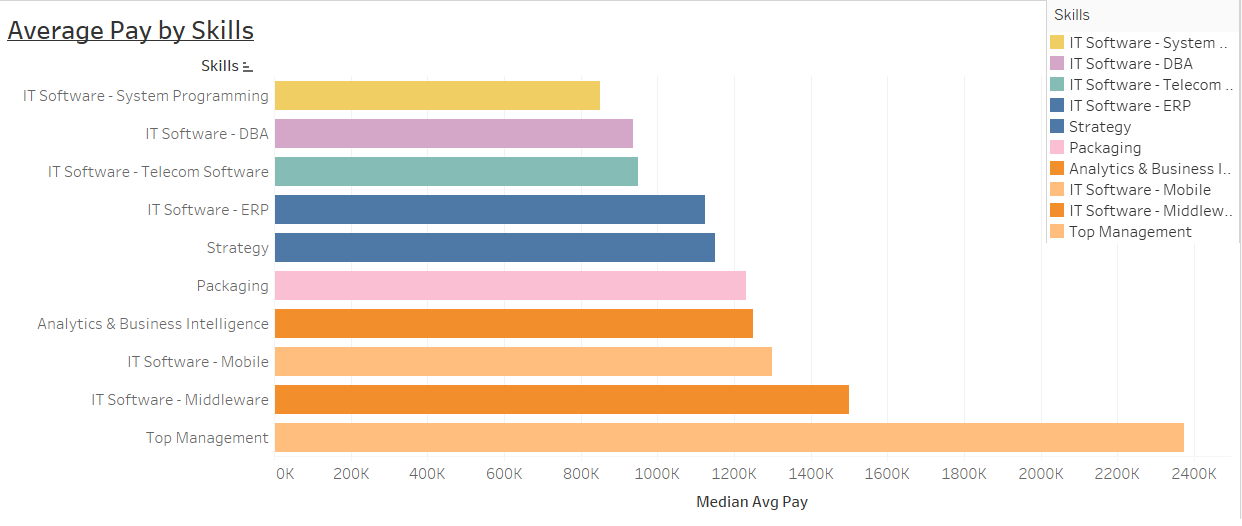
Top Avg pay by skills
-
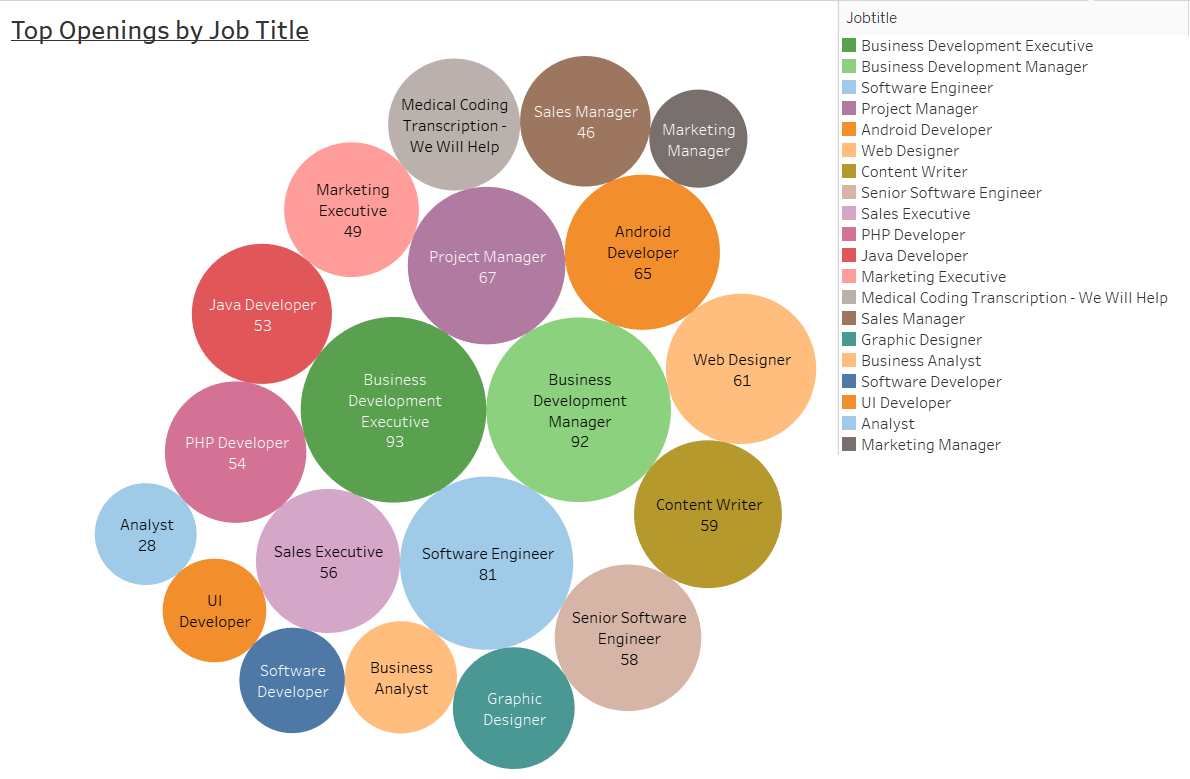
top openings by job title
-
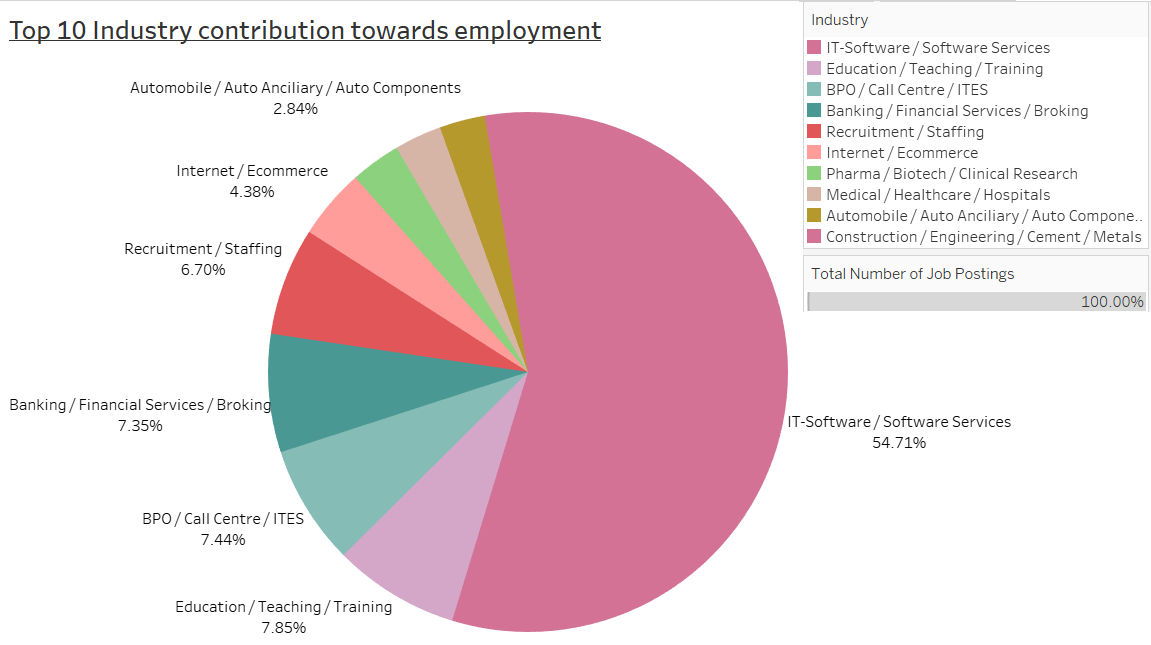
total number of contribution towards employment
Project Description
This project is a part of the continuous assessment for Data Visualisation module where we were asked to prepare a business magazine-style report.
Project Details
Module Name: Data Visualisation
Duration: 21st January, 2019 - April, 2019
Tools Used: R Code to clean Data, Tableau & Datapine - Charts, Magazine Template and Data visualisation principles
Business Requirement Document
Project Report Document
Note:
These documentations are shared only as a demonstration of work of author and any contents copied or referred or recreated in any means for own academic or professional purposes will not be accepted and legal actions would be taken against those offenders.
View All ProjectsCopyright © Dharmendra Vishwakarma (vdharam), 2024 | This site is hosted on GitHub Pages and last updated on 28th December, 2025. | Check Website Code
Connect with me : LinkedIn | Twitter | Github | Codepen | StackOverflow | Free Code Camp | HackerRank | Quora | Medium | DataCamp