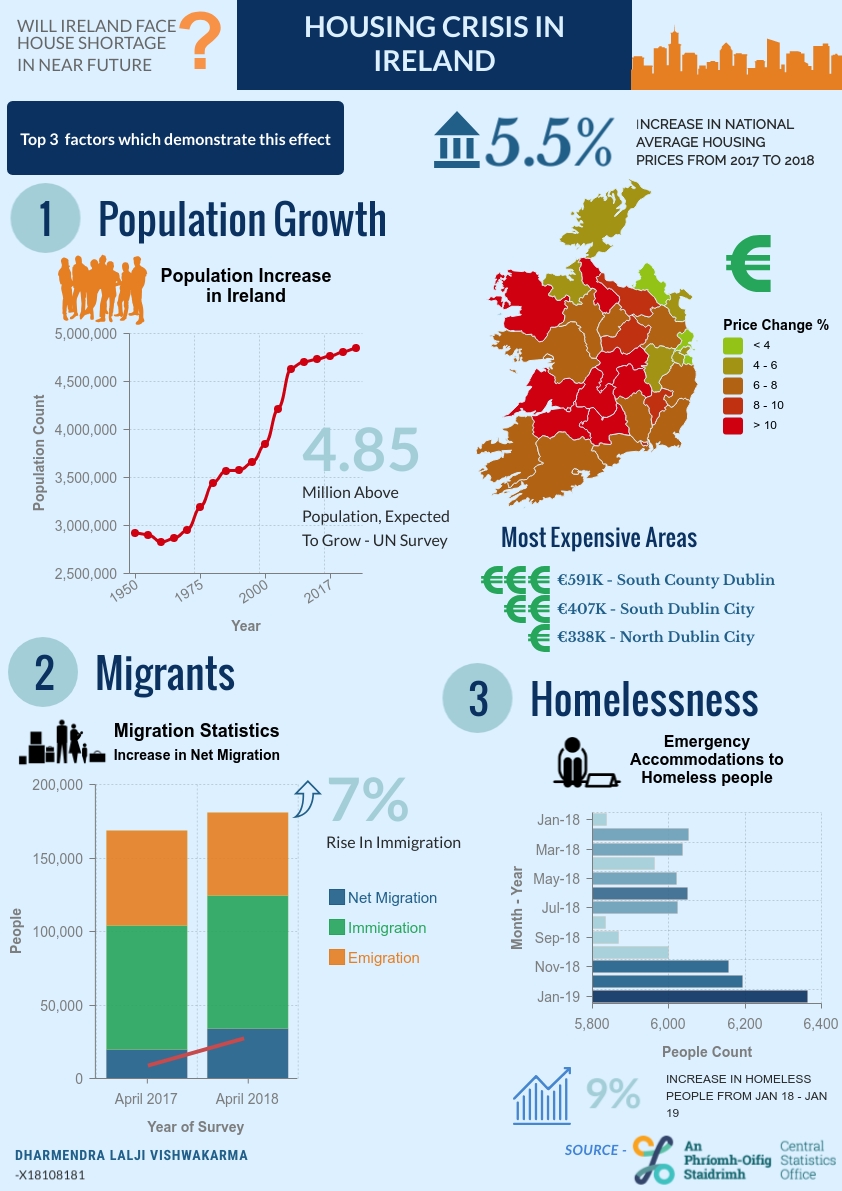
An Infographic on Housing problems in Ireland
Project Description
The objective of this assignment is to tell a story using data via the medium of an infographic.
Project Details
Module Name: Data Visualisation
Duration: 21st January, 2019 - April, 2019
Infographic
Business Requirement Document
Project Report Document
Note:
These documentations are shared only as a demonstration of work of author and any contents copied or referred or recreated in any means for own academic or professional purposes will not be accepted and legal actions would be taken against those offenders.
View All ProjectsCopyright © Dharmendra Vishwakarma (vdharam), 2024 | This site is hosted on GitHub Pages and last updated on 28th December, 2025. | Check Website Code
Connect with me : LinkedIn | Twitter | Github | Codepen | StackOverflow | Free Code Camp | HackerRank | Quora | Medium | DataCamp